Announcing the new DocRead 365 Analytics ModuleWe are thrilled to announce the release of ...
Keeping track of compliance tasks for new hires with Power BI
Ensuring all of your compliance tasks are completed on time and by the right people can be complicated. Additional complexity arises when new people join the organization, or move within it. However, as with a lot of things, a little control and planning can minimize your exposure to non-compliance.
In this post we are going to show how you can use PowerBI to find out which documents have been assigned to a specific audience using DocRead. This will allow you to ensure that all documents (policies/ compliance requests etc.) have been assigned to the correct audience. It will also help you spot any items that have been assigned in error.
With its own dedicated reporting engine (VertiPaq - “Brains & Muscles” behind Power BI), Power BI has no problem working with large data sets. When combined with the rich data created by DocRead, it allows you to create beautiful and powerful reports giving insights about how your SharePoint content is being targeted, read and acknowledged by your users. These reports can also be used to demonstrate to regulators how you are communicating, targeting and tracking your Policies, Procedures (and any other important content) and thus ensuring that your employees remain compliant with them.
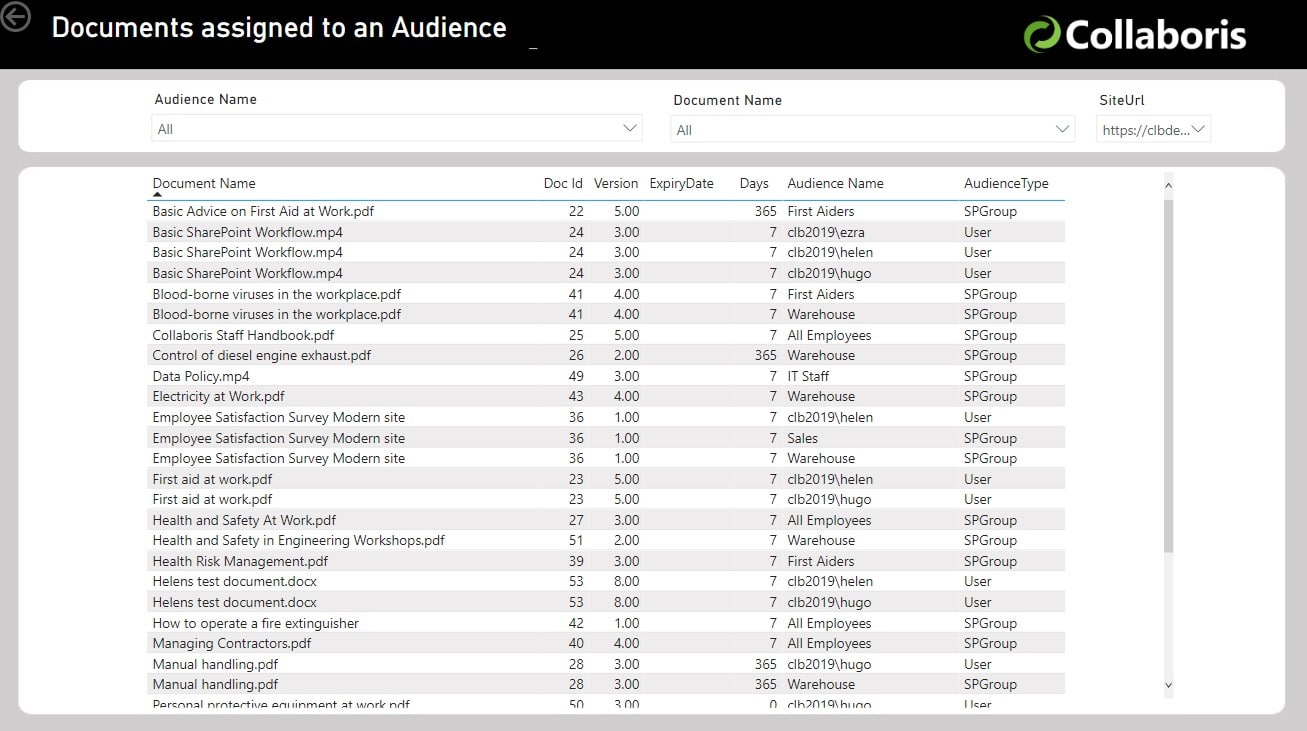
The “Documents assigned to an Audience“ report that we are going to build in this post will look like this:
The report above uses the standard data view called "Readership.vwTaskInfo" available in the DocRead database (find more information here). It contains three slicers at the top of the page that allows you to select a specific audience, document and site. The table then shows a list of all documents that have been assigned to the selected audience.
The remainder of this post will explain how to create this dashboard in Power BI.
Table
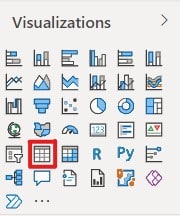
1) Select the table visualization. This will add a table onto your report canvas. Move and resize it across the center of your report page.
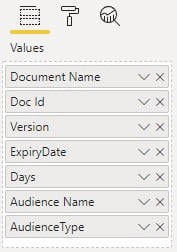
2) From the Readership vwTaskInfo table, select 'DocumentName', 'DocumentID', 'DocumentVersion', 'ExpiryDate', 'Days', 'AudienceName' and 'AudienceType' or click and drag them into the Slicer Field.
3) They will appear in the report table in the order they are shown. You can click and drag them to rearrange them as required.
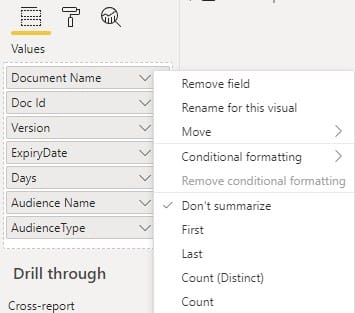
4) Use the drop down arrow at the side of each field to adjust the settings as needed. All fields for this table should be set to 'Don't summarize'. You may also like to use the 'Rename for this visual' option to add spaces into the field names.
5) Your data table is ready and should look similar to the example below.
Slicers
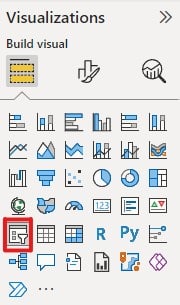
1) Select the Slicer visualization as shown below. This will add a slicer onto your report canvas. Resize it and move it to the top left corner of your report canvas.
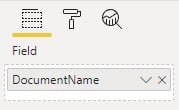
2) From the 'Readership vwTaskInfo' table, select 'DocumentName', or click and drag it into the Slicer Field.
3) Click on the down arrow for this field and select 'Rename for this visual'.
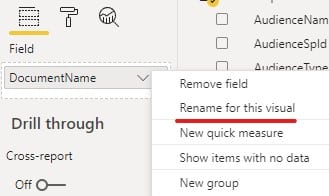
4) Add a space into the field name so it displays as 'Document Name'.
5) On the report canvas, click the down arrow in the top right corner of the slicer and select 'Dropdown'.

6) Your slicer is now ready.
7) Add two more slicers to your canvas and position them along the top of your report.
8) Repeat steps 2-5 to create slicers for the 'AudienceName' (found in the 'Readership Audience' table) and 'SiteURL' (found in the 'Readership Document' table) fields.
Notice how the data in the table changes as you select different combinations of audiences, documents and sites.
Add a report background
To make your report look more appealing or fit in with a corporate color scheme, you may like to add a background layout. This post explains how to do this.
See how DocRead can help
DocRead allows you to fully automate your internal communications without leaving SharePoint. Automatically assign reading and training to new employees, ensure compliance with policies, and keep staff updated with announcements and news.
DocRead has enabled us to see a massive efficiency improvement... we are now saving 2 to 3 weeks per policy on administration alone.
Nick Ferguson
Peregrine Pharmaceuticals
Feedback for the on-premises version of DocRead.
You may also like:
October 24, 2024
June 13, 2022
Creating a SharePoint document library dashboardSharePoint provides excellent opportunities to create document repositories. You ...
May 30, 2022
Create a Reporting Hierarchy in Power BI Creating hierarchies in your Power BI data ...
May 17, 2022
Advanced DocRead reporting with Power BI The DocRead reporting suite provides several reports to help you manage ...
May 16, 2022
Downloadable background templates for Power BI reportsPower BI allows you to create amazing visualizations ...
May 13, 2022
How to import your DocRead data into Power BIThe DocRead reporting suite provides several ...

