Announcing the new DocRead 365 Analytics ModuleWe are thrilled to announce the release of ...
Creating Report Backgrounds for Power BI
Power BI allows you to create amazing visualizations from your data. You can easily get carried away and create hundreds of different combinations.
Once you have worked out the best way to summarize and display your data, chances are your Power BI report screen will look something like this:
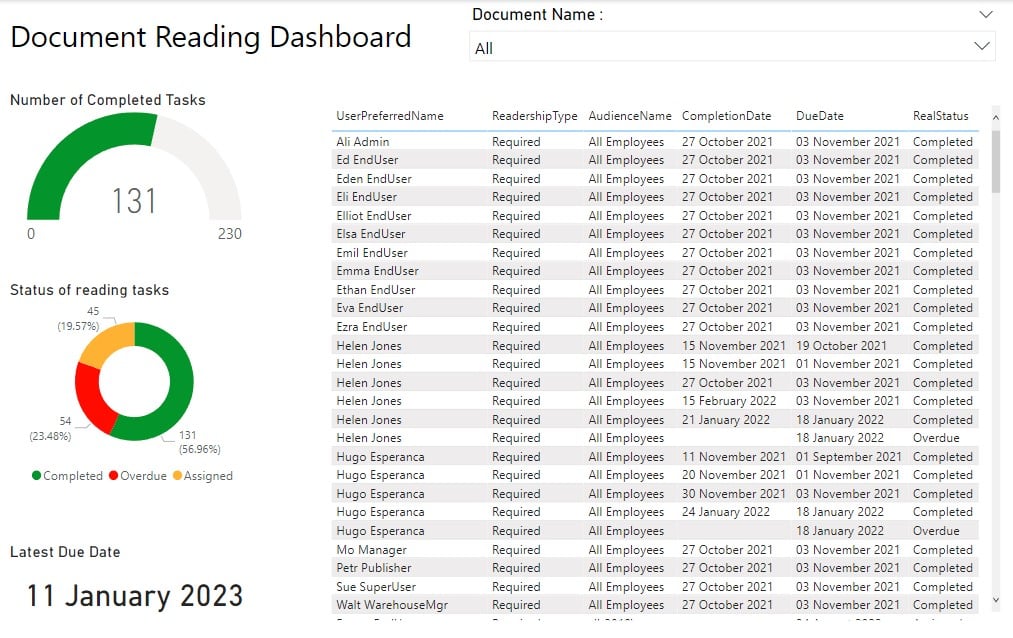
My report above uses the standard data available in the DocRead database view. It contains a slicer at the top of the page that allows you to select a specific document. The table then shows a list of all employees who need to read that document and the date they did so. If the employee has not completed their reading task, then this will be shown as either overdue (if the due date has passed) or assigned.
The visualizations on the left include:
i) a gauge showing the proportion of completed tasks compared to the total number of tasks.
ii) a donut chart showing the number or reading tasks by status (assigned, completed or overdue) and their proportionate percentages.
iii) a card displaying the latest due date. Once this date has been reached, and assuming everyone who needs to read it, has done so, it can be archived.
Although my report contains a lot of really important information, it looks a bit boring! It is really easy to create and add a background image to your Power BI report and make it look more appealing. I'm no Picasso, and I'm sure that many of you will think the report below could be improved, but I think it looks way better than the original effort.
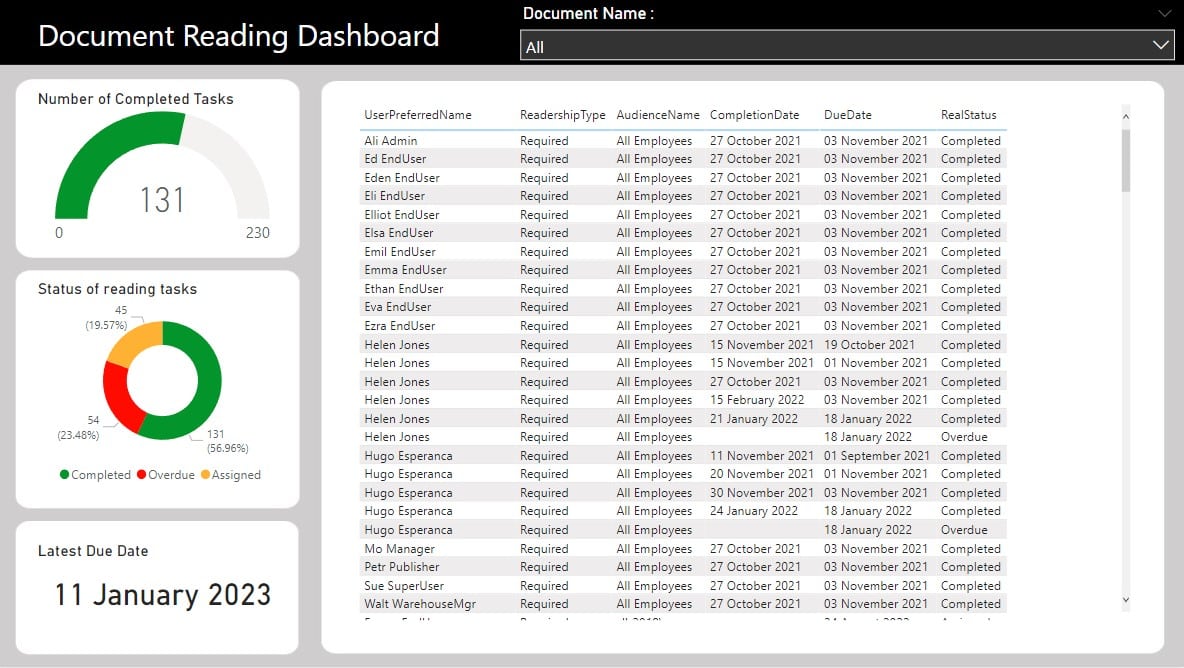
Creating your bespoke report background image
- Firstly create all of your visualizations and size them appropriately. There is no need to be exact, just a rough size and placement on the Power BI report will suffice at this stage.
- There are many different ways to create an image. You could use your preferred publishing tool or graphics package to create something fancy. I went old school and simply used a word document and created shapes that layered on top of one another.
- I then took a screenshot and saved the picture as a .jpg My report background looked like this.

FREE Downloadable Templates
If you'd like a quick start, this post contains downloadable templates that you are welcome to use. They could make a great starting point and are amendable so you can tweak them to suit your needs.
How to add a background image to your Power BI report
1) Click on an area of your Power BI report that doesn't contain a visualization. Keep clicking around until you manage to find a spot that means you don't have a visualization selected.
2) Click the 'paint roller' icon to view all of the styling options for the report page.
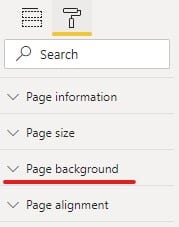
3) Then click the drop down arrow for 'Page background'. You should see the following options:
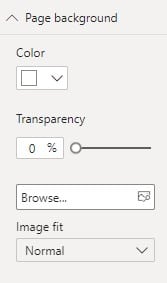
4) Use the browse option to find the report background image you have just created and also select 'Fit'. This will stretch your image to fit the size of your report page.
5) Set the transparency to 0% so your background is displayed.
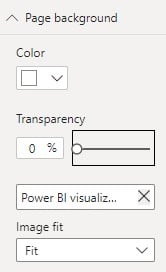
6) Tweak the size and placement of your visualizations to fit into the report you created. You may also need to adjust the font color of titles, legends, slicers etc. so they contrast with your new background colors.

I hope you've found this useful and have fun making your own reports and adding background images in Power BI.
October 24, 2024
June 13, 2022
Creating a SharePoint document library dashboardSharePoint provides excellent opportunities to create document repositories. You ...
May 30, 2022
Create a Reporting Hierarchy in Power BI Creating hierarchies in your Power BI data ...
May 17, 2022
Advanced DocRead reporting with Power BI The DocRead reporting suite provides several reports to help you manage ...
May 16, 2022
Downloadable background templates for Power BI reportsPower BI allows you to create amazing visualizations ...
May 13, 2022
How to import your DocRead data into Power BIThe DocRead reporting suite provides several ...
