Advanced DocRead reporting with Power BI
The DocRead reporting suite provides several reports to help you manage your compliance tasks. The out-of-the-box reporting options allow administrators and line managers to track progress with real-time reports. Whilst powerful out of the box, it's impossible for the suite to cover more customised reporting requirements. That's where Power BI comes in. With its own dedicated reporting engine Power BI has no problem working with large data sets. When combined with the rich data created by DocRead, it allows you to create beautiful and powerful reports giving insights about how your SharePoint content is being targeted, read and acknowledged by your users.
Here is a list of all of the DocRead and Power BI related posts I have recently created.
How to link your DocRead database to Power BI
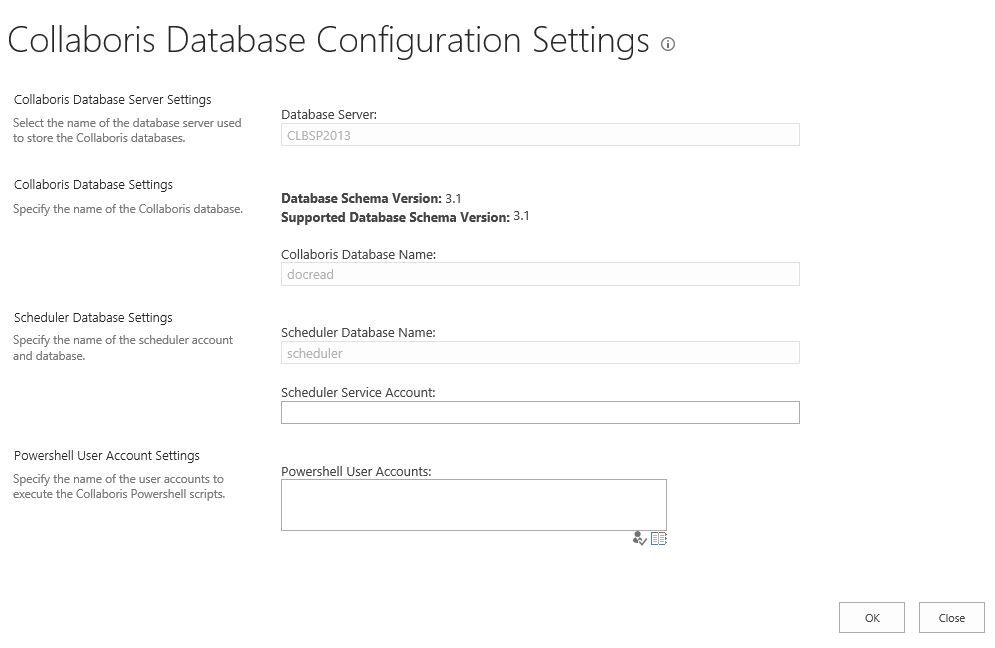
This post explains how to get your DocRead databases into Power BI desktop so you can use them to create bespoke reports.
The DocRead database is automatically created when you install DocRead and contains special views with all of the information you are likely to need. Details can be found in the Collaboris Database Configuration setting in SharePoint Central Administration. Alternatively, you may need to ask your SQL Server Administrator for the details.
Display the status of DocRead reading tasks
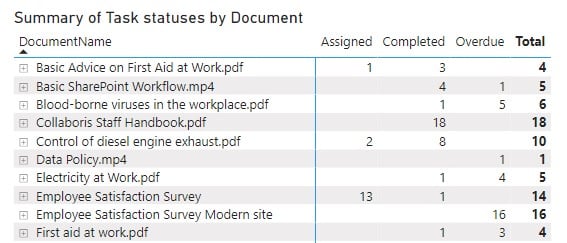
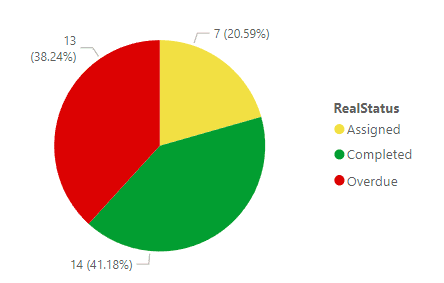
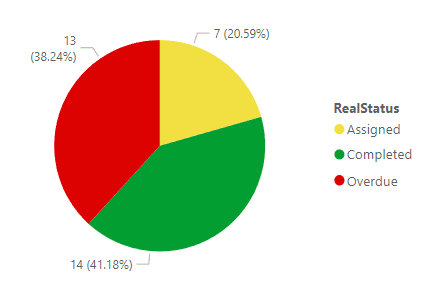
This post explains how to create an overall status for each DocRead task (completed assigned or overdue).
The DocRead database contains two key fields. The first states whether the task is completed or assigned (i.e. not completed). The second field states whether the task is overdue or not (a boolean field). Both of these fields need to be used to calculate a single field that can be used in visualizations.
Audience report - which documents are being assigned to your users
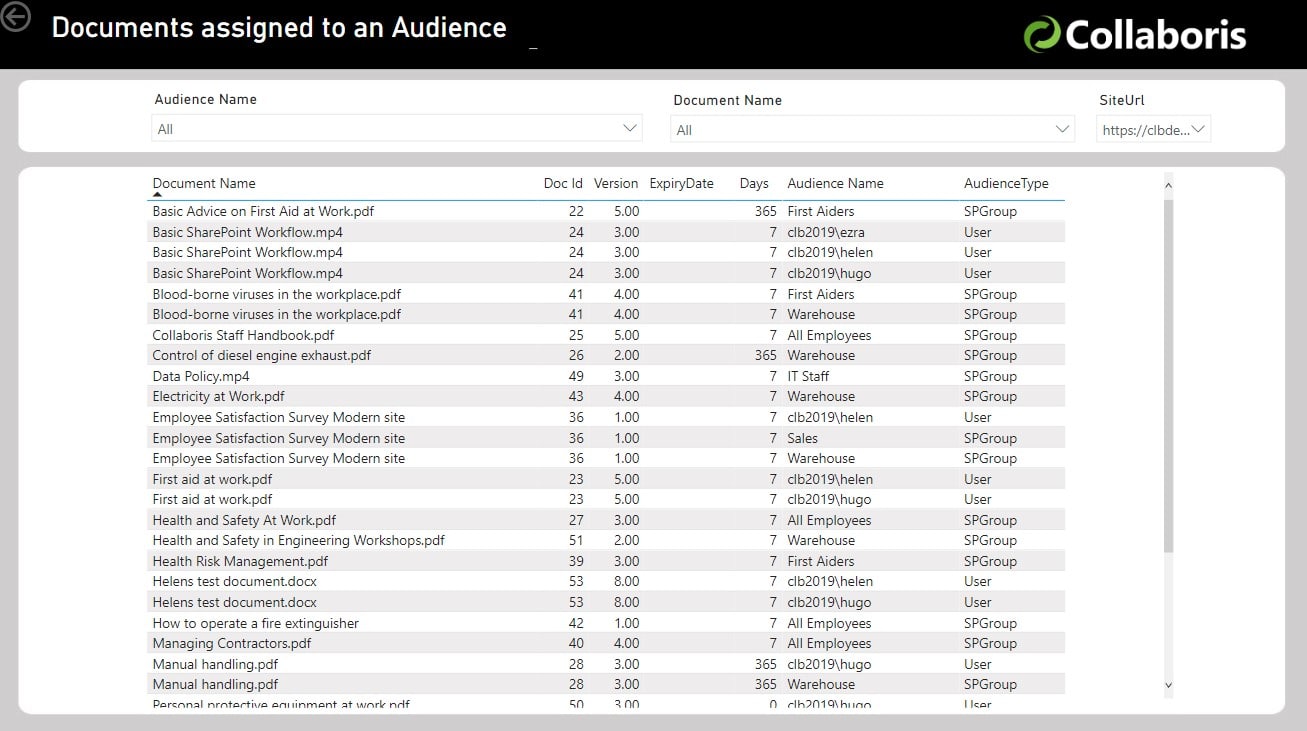
This post shows how you can use Power BI to find out which documents have been assigned to a specific audience using DocRead. This will allow you to ensure that all documents (policies/ compliance requests etc.) have been assigned to the correct audience. In addition, it will also help you spot any items that have been assigned in error.
Document Reading Dashboard
In this post we show how you can use Power BI to create a “Document Reading Dashboard” using the DocRead data. This dashboard can be used to show the status of the reading tasks associated with a specific document (these tasks are automatically generated, and managed by DocRead ). A video showing the creation of the dashboard in Power BI is also available.
Improving the appearance of reports with custom backgrounds
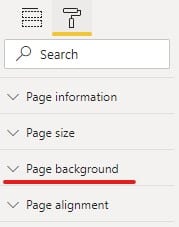
This post explains how I made my report dashboards using simple shapes in Word.
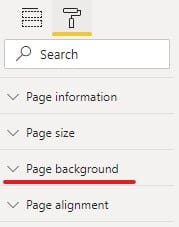
Power BI allows you to create amazing visualizations from your data. After you have worked out the best way to summarize and display your data, adding a background can make your dashboard really stand out.
Downloadable background templates for your Power BI reports
If you want a starting point, this post contains links to the report dashboards I used for my reports. You are welcome to download and use these. They are word documents so can be amended to fit your reports or corporate look & feel.
Once you are happy with the format, you need to save them as a picture before uploading into Power BI.

Summarizing DocRead Task Information in Power BI
Is your SharePoint content read on time and by the right people?
DocRead can help

