Announcing the new DocRead 365 Analytics ModuleWe are thrilled to announce the release of ...
Create a Reporting Hierarchy in Power BI
Creating hierarchies in your Power BI data provides opportunities to further enhance reporting capabilities. For instance, Power BI will automatically calculate a date hierarchy. This will allow you to drill down from annual data, to quarters, months and days. You can also create bespoke hierarchies within your data to represent other relationships. Hierarchies will allow you to provide drill through visualizations, dashboards and reports to your users for easier analysis.
Examples of hierarchies:
- A geographic hierarchy could allow you to drill down from Country, to State, City, and Street.
- A product hierarchy could allow you to drill down from product category, to subcategory and individual item.
- A personnel hierarchy could reflect the organization structure from Director, to Manager, Team Leader and individual.
Firstly, this post will explain how to create a hierarchy in Power BI. Then it will suggest data hierarchies that you may find useful in DocRead data. Finally, it will show an example of a hierarchy in Power BI and how it is reflected in a visualization.
How to create a hierarchy in Power BI
1) A hierarchy needs to be created in the fields area of Power BI. Firstly decide on the levels of data that you want to use in the hierarchy.

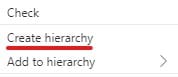
2) Start at the top level of the hierarchy. Click on the ellipsis menu for that data field to see the available options, then select 'Create hierarchy'.

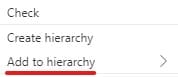
3) Use the same 'options' menu for the other fields you want to use in the hierarchy and select 'add to hierarchy'. Select the hierarchy you created in step 2.

4) Continue by repeating these steps until you have added all levels into the hierarchy. Click and drag the fields into the correct hierarchy order so they are displayed in the fields list from top level to lowest level. The order they are shown will reflect how the drilldown levels work in the subsequent reports.

Understanding DocRead Compliance Data
The DocRead database is automatically created when you install DocRead. The 'Readership vwTaskInfo' table contains most of the information you are likely to need for reporting purposes. This view was created specifically for reporting to ensure that any queries do not affect the original databases.
The 'Readership vwTaskInfo' table contains (amongst other things):
1) Details about the documents that have been assigned, document ID, location, version, type, comments etc.
2) Details about who the items were assigned to, audiences, users, user email etc.
3) Details about task deadlines, due date, completion date, status etc.
Is your SharePoint content read on time and by the right people?
DocRead can help
DocRead Data Hierarchies
We recommend creating any data hierarchies for Power BI in the DocRead 'Readership vwTaskInfo' table. This will ensure the data integrity of the main DocRead database is maintained.
Here are some hierarchies that you may find useful:
Audience Name Hierarchy
1) AudienceName
2) DocumentName
3) UserPreferredName
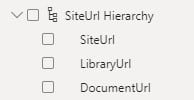
Document location hierarchy
1) SiteURL
2) LibraryUrl
3) DocumentURL
Report example using the Audience name hierarchy
After you have created your hierarchies, you can begin to use them in visualizations. You need to ensure that you use the data fields from within your hierarchy and not the original database fields.
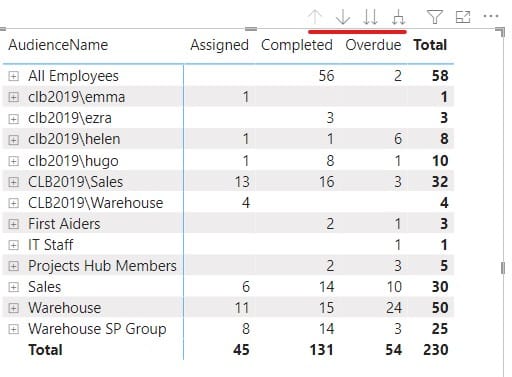
The drilldown icons highlighted below will be displayed above your visualization and allow you to navigate through your hierarchy.
For example, the image below shows the reading status of tasks assigned to different audiences by DocRead. Each audience is displayed on the left hand column with a '+' image next to it, indicating additional detail is available. The matrix report shows a total of 230 tasks, of which 54 are overdue.

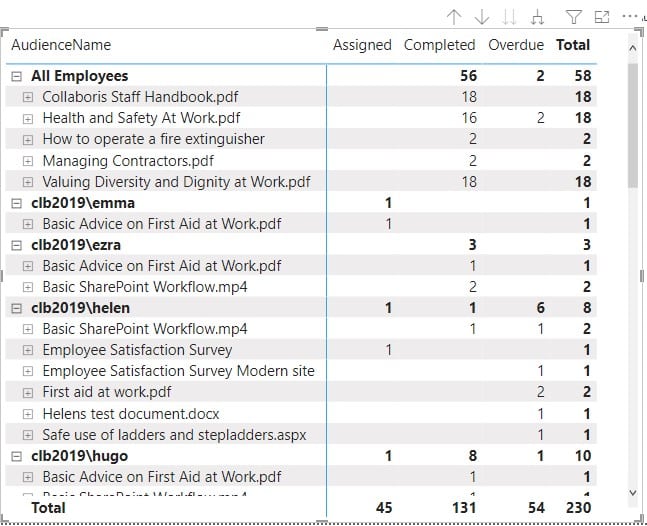
Clicking on the icon to 'Expand all down one level in the hierarchy' changes the report as shown below. Each Audience has been expanded to show the reading status for compliance documents that have been issued to that audience. The total number of tasks (230) is still displayed at the bottom of the visual. A scroll bar can be used to view more of the detail in this report. Notice that the documents have '+' signs indicating additional levels of detail are available.
The report below shows that 18 tasks have been completed for the Collaboris Staff Handbook.

Expanding the hierarchy further to the User level will display the names of the people within the audience that received each document.

You can either use the arrows above the visualization, or the '+' and '-' icons to the left of each level to display the level of information required.
Tired of reminding staff to read your company policies?
DocRead makes compliance simple
You may also like:
October 24, 2024
June 13, 2022
Creating a SharePoint document library dashboardSharePoint provides excellent opportunities to create document repositories. You ...
May 30, 2022
Create a Reporting Hierarchy in Power BI Creating hierarchies in your Power BI data ...
May 17, 2022
Advanced DocRead reporting with Power BI The DocRead reporting suite provides several reports to help you manage ...
May 16, 2022
Downloadable background templates for Power BI reportsPower BI allows you to create amazing visualizations ...
May 13, 2022
How to import your DocRead data into Power BIThe DocRead reporting suite provides several ...