SharePoint Survey Results Analysis
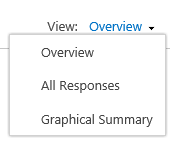
There are a few options once you are ready and would like to analyze SharePoint Survey Results. Three views are available to you “out of the box” and also the option export to spreadsheet. Below we will discuss the various options available to you to analyze the SharePoint Survey Results you have worked hard to collect!
 Overview
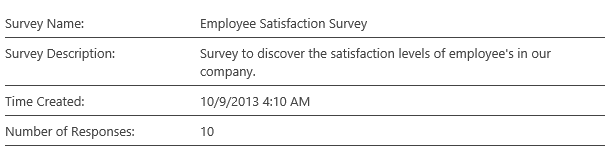
The overview summaries the survey (surprisingly) detailing the time created and the number of responses. Responses are only counted when the user has answered all required questions and clicked through to the finish to complete the survey. Partial responses are not counted.
Graphical Summary
All Responses
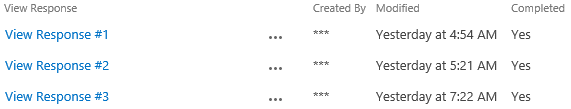
This will list all responses as with lists you can sort and filter the list clicking on the column titles. You can see here how to alter the data to create an an anonymous sharepoint survey.
If you wish to add columns to all responses the you can change the view by doing the following.
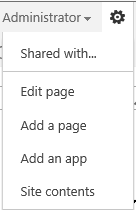
1. Click on ‘Settings’ clock the on ‘Edit page’
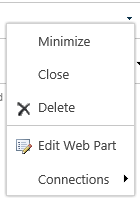
2, On the Web Part small down arrow to access the dropdown menu for the web part > Click ‘Edit Web Part’
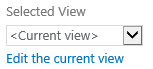
3. Now in the edit settings of the web part within ‘List Views’ section click ‘Edit the current view’
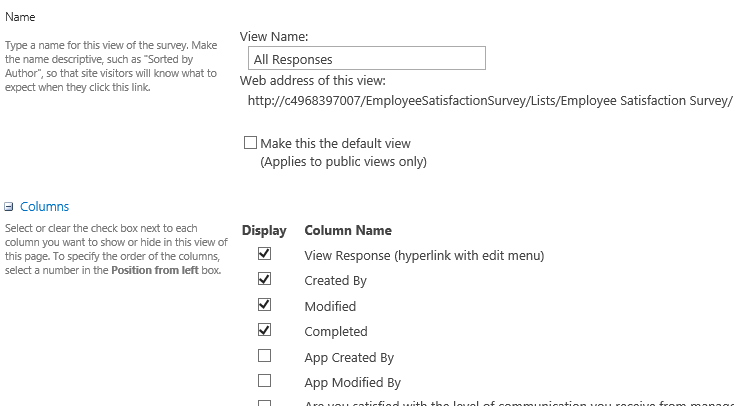
4. You now have access to alter the view in the way you can alter all other views, add remove columns, sorting, filtering, group bys etc.
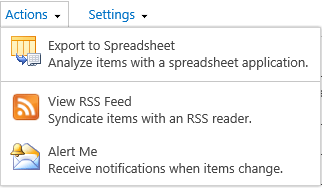
5. Export to Spreadsheet (Excel)
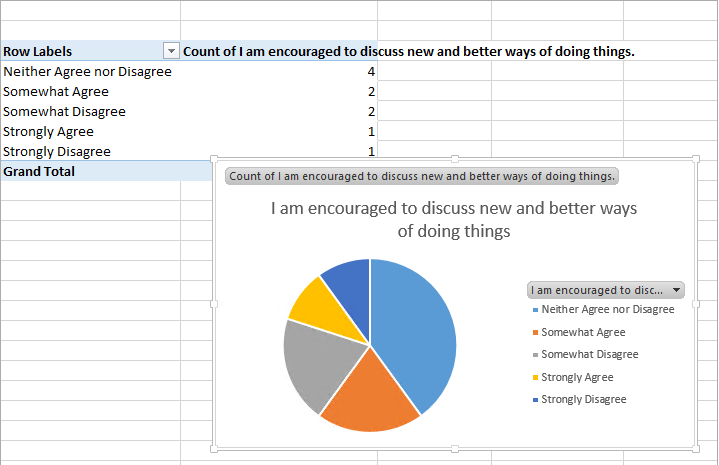
Possibly the most powerful button you can use with the SharePoint survey results set is to export it to excel.
With the ‘Design’ tab in Excel you can then click to ‘Summarise with PivotTable’ which is a very powerful tool.